By Judy Benson
Photos can be powerful storytellers, even for the photographers themselves.
Just ask Joe Orchardo.
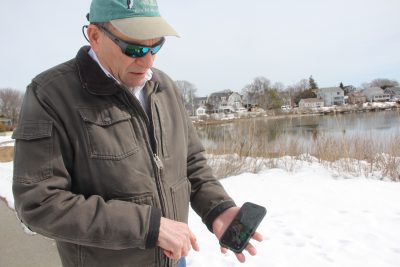
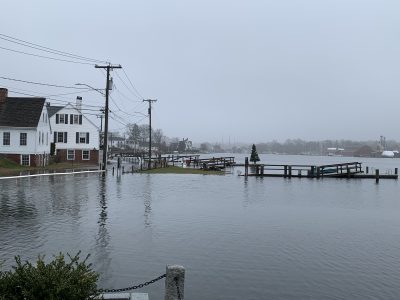
Often on daily walks with his wife around their shoreline neighborhood of Groton Long Point, an association of 640 homes, he’ll snap a photo or two on his cell phone and upload them to MyCoast Connecticut. The website collects scenes of flooding and other weather-related damage that are occurring with increasing frequency as sea level rises and storms intensify.
“We have flooding here a few times a year,” he said. “Any house that has been renovated in the past five years is being raised to FEMA (Federal Emergency Management Agency) flood requirements, about two to three every year.”
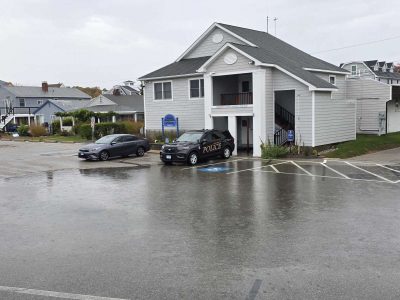
One day last March, he walked the neighborhood with a visitor to show some of the areas that have been underwater from storm and tidal surges and storm drain overflows. He paused in front of the small building that serves as Groton Long Point’s police and fire station.
“This parking lot had a foot of water in it after the nor’easter in November,” he said, pulling up a MyCoast photo on his phone that another resident had uploaded at the time.
Orchardo, who serves as the director of long-range planning for the community, is an enthusiastic ambassador for MyCoast Connecticut, a pilot project in Groton, New London and Stonington launched in April of 2025. Its organizers envision it becoming a statewide initiative in the near future. Other Connecticut communities including Branford, Clinton, Greenwich, Milford, Old Lyme, Old Saybrook and Westbrook have either started using it on their own or have expressed interest in joining MyCoast Connecticut.
“One of the most important aspects of MyCoast is that it has raised awareness in the community that flooding is an issue and it’s being observed,” Orchardo said. “People here enjoy contributing to a community science project and are getting a lot out of it.”
Created for the Massachusetts Office of Coastal Zone Management 15 years ago, MyCoast has thus far been licensed for use in eight East and West Coast states and the Virgin Islands, with funding coming from different sources in each. It basically serves as a web-based scrapbook, but instead of chronicling a family or world travels, it documents high tide and storm flooding and impacts. Community members and public officials alike contribute the photos. They are connected by an app and receive app notifications in advance of potential flooding events that also emphasize keeping safety foremost in any photography excursions. The photos are displayed on the MyCoast site alongside the date, time, weather and tidal data and other information.
Sarah Schechter, assistant extension educator at Connecticut Sea Grant, learned about MyCoast as a graduate student intern with the Rhode Island Sea Grant program, which has been using it since 2014.
“I was really excited to see all the photos MyCoast was able to capture, and the community science focus,” she said. “Whenever I see flooding or crazy weather happening, I’m always taking photos and it was great to learn that there is a place to document these events.”
Soon after she was hired to join the Sustainable and Resilient Communities team at Connecticut Sea Grant in 2023, Schechter connected with interested partners to start a MyCoast Connecticut pilot, then applied for and received grant funds for the license. Two like-minded environmental organizations conveniently located in the same building as Connecticut Sea Grant on the UConn Avery Point campus agreed to join, the Connecticut National Estuarine Research Reserve, and the Connecticut Institute for Resilience and Climate Adaptation.
“All the surrounding states (New York, Massachusetts and Rhode Island) had MyCoast,” said Schechter, “but the data was missing in Connecticut.”
Massachusetts was the first state to start using MyCoast, in 2011. At the time, said Julia Knisel, coastal shoreline and floodplain manager at the Massachusetts Office of Coastal Zone Management, efforts had been under way since Hurricane Bob in 1991 to document coastal flooding and erosion in a systematic way for better storm response and recovery project planning. As coastal storm reporting evolved, MyCoast became available as a natural fit to that initiative and expanded into community engagement. Community members and municipal officials were encouraged to upload photos of storm impacts and also King Tide “sunny day” flooding when higher than normal tidal waters overflow onto roads, parking lots and around homes.
More than 1,800 Massachusetts users mainly in five coastal regions have signed on to use the MyCoast app, submitting some 20,000 photos and a few videos since it began. The most frequent users, she added, are municipal and state officials who support the Massachusetts Coastal Storm Damage Assessment Team.
“About 60 percent of the people who’ve signed up have submitted photos,” Knisel said. “A lot of people are there out of curiosity, to see the flooding in their neighborhoods or to look at the tidal tool.”
Knisel listed several examples of tangible benefits from MyCoast: better data to plan coastal resilience projects; images that document the effectiveness of those resilience projects over time; information to improve flood risk mapping, aid planning for emergency response to storm events and calculate damage assessments.
“A few police officers have even used the tool to determine when a road needed to be closed,” she said.
Next steps for MyCoast in Massachusetts will be to expand into inland communities with increasing coastal flooding vulnerability, especially those along rivers.
Rhode Island, which joined MyCoast soon after Massachusetts, is also expanding its focus beyond the shoreline to inland areas, especially those prone to river and stormwater flooding. About 1,900 people have signed up for MyCoast RI, submitting some 5,900 photos thus far.
“About 1,000 of the users are actively putting in pictures,” said Casey Tremper, coastal resilience specialist at Rhode Island Sea Grant. “Our partners have been essential in reaching community members and helping us understand how they’re experiencing flooding.”
One of those partners is the Woonasquatucket River Watershed Council, which represents a Providence neighborhood with a large Hispanic population.
“We have been working with residents with the support of the council to ensure the new app is inclusive and accessible,” Tremper said, adding that the council shares the information in Spanish and English with residents. MyCoast photos are being used to develop a proposal for an urban greenway in the neighborhood to help absorb floodwaters, she said.
Another Rhode Island community that has seen tangible benefits from MyCoast is Wickford, a coastal village within the town of North Kingstown where a parking lot and roadway in the commercial center was closed frequently due to flooding. The troubling scene was captured in many MyCoast photos that were put to use in crafting a solution.
“The town used the MyCoast pictures to help get funding for the project,” said Tremper. It included elevation of a seawall, improvements to stormwater flows and construction of a rain garden.
Tremper said the utility of MyCoast becomes more apparent daily, as the trajectory of flooding and storm intensity shows no sign of letting up.
“In Rhode Island, we’ve seen 10 inches of sea level rise since 1930, and it’s projected to rise another 1½ feet by 2050,” she said. “Rainfall is now 70% more intense than it was in the 1950s. MyCoast gives people actions they can take to be able to record what’s happening.”
Among the three MyCoast Connecticut pilot communities, most of the MyCoast photos thus far have come from Groton—comprised of the separate municipalities of Groton Town and Groton City. Officials in both the city and town are strong proponents.
“I’m really psyched about it, because it raises awareness and it’s a huge help to have the public out there documenting this for us,” said David Prescott, Groton Town land use planner. “In the town, we’re very aware of the consistent flooding we have in the community, in places like downtown Mystic—which is a huge economic engine for us—and in Willow Point, on South Road and Depot Road. We’re looking at all these areas from the standpoint of the town’s infrastructure, emergency access and the stormwater system.”
MyCoast photos, he said, are being used to help prioritize public works projects, for long-range planning and in grant applications. Reaching out to get more community members using MyCoast, he said, will be critical for dealing effectively with the realities of being a coastal community.
“We’re really trying to get that core of volunteers, so when that alert goes out we get as many people out taking photos as possible,” he said.
Like Prescott, Cierra Patrick, Groton City’s economic development manager, can also readily lists the parts of the city subject to frequent flooding: the Five Corners, Jupiter Point and Eastern Point neighborhoods and four main roads—Poquonnock, Mitchell, Hamilton and Benham —among others. When MyCoast CT started last year, she recalled, the city had recently finished a community resilience plan, which identified stormwater flooding as a key problem.
“We figured it all meshed, because we really needed to collect data for resilience work,” Patrick said. “We’ve been using the tool to capture the real-time data to feed into a model for a project we’re developing. MyCoast also allows the community’s voice to come in, along with those of the scientists and planners, so instead of just getting mad about flooding they can report it.”
The biggest challenge for MyCoast CT thus far, said Larissa Graham, education coordinator at the CT NERR, has been connecting with community members. Municipal officials, she said, quickly understand the value of the tool because they deal with flooding routinely.
“It takes a lot of effort to find those community members who are being impacted,” she said.
Groton, New London and Stonington each have unique flooding issues, economic and social characteristics and governmental structures. New London is a small urban community. Groton is a mix of urban and residential neighborhoods with several large employers and substantial commercial development. Stonington is mostly rural and suburban.
“We need to use different techniques for the different communities,” Graham said. The trial-and-error over the past year of figuring out the most effective types of outreach, she added, will be helpful as MyCoast goes statewide.
With more than 160 photos submitted by 34 users in Groton, New London and Stonington since the MyCoast Connecticut pilot started, the project is well on its way to demonstrating its usefulness, Schecter said. That will be critical in obtaining the funds needed to expand MyCoast CT to the entire state.
“We’ve already had interest in using the photos for grant applications to justify future projects, and we look forward to seeing how MyCoast will contribute to changes throughout Connecticut,” she said.
To sign up for MyCoast CT, visit: https://seagrant.uconn.edu/focus-areas/resilient-communities/mycoast-connecticut/